Evaluation of Selected Numerical Weather Prediction Models for a Case of Widespread Rainfall over Central and Southern Nigeria
Author: Chibuzo N
Agogbuo
Abstract
Precipitation forecasts from four Numerical Weather
Prediction (NWP) models are evaluated for a case of widespread rainfall
event over Central and Southern Nigeria on the 21st of March
2015. The four models evaluated are the European Centre for Medium Range
Weather Forecast (ECMWF) with a resolution of 25 km, The UKMET model
20km, NCEP Global Forecast System (GFS) 50km and the Weather Research
and Forecast Model (WRF) with 10km resolution. Precipitation forecasts
are compared with observed precipitation at station and gridded
observation points for different rainfall amount thresholds using the
Method of Objective-based Diagnostic Evaluation (MODE), Grid statistics
and Point Statistics.
The global models ECMWF, UKMET and GFS underestimated the rainfall
amount when compared to the WRF regional model. The global models
recorded a critical success index (CSI) of less than 10% while the
regional WRF model recorded a critical success index of 40% for rainfall
amount greater than 25mm. MODE analysis showed that the WRF model also
recorded a 93% relationship between observed and forecast precipitation
events of 21st March 2015 over Nigeria when compared with the
ECMWF, UKMET and GFS models which showed 88%, 88% and 87% relationship
respectively. Our findings suggest that dynamically down scaling a
global model using the WRF model added value and gave a better skill of
precipitation forecast for the event under study.
Keywords: Numerical weather
prediction; Global modeling; Regional model; Method of objective-based
diagnostic evaluation (MODE); Dynamic downscalingIntroduction
Precipitation forecast especially during the onset period is not a very easy task for weather forecasters owing to the fact
that rainfall is a dichotomous weather variable. Numerical
weather prediction models have been used since 1946 to forecast precipitation and other atmospheric variables [1].
The use of these NWP models has lead to a considerable advancement in
precipitation forecasting. This is largely due to the horizontal grid
spacing of a few kilometers of these NWP models expected to reduce
further in the coming years [2].
Accurate precipitation forecast is very important considering the fact
that extreme rainfall events could lead to devastating effects such as
flooding, aviation hazards amongst others. The principal aim of this
research is to compare precipitation estimates from 3 global models and a
regional model, referenced against satellite estimates combined with
station data and to ascertain if a dynamically downscaled global model
added value to the precipitation forecast. NWP models show different
performance skills for various regions and domains. Therefore, the
evaluation of a Numerical Weather Prediction model forecast by comparing
it with observed data is key to ascertaining its reliability over a
particular place. Ghelli et al. [3]
have also noted that forecast verification provides the forecast users
with uncertainty information that helps them in their decision making.
However, before evaluating a weather forecast, two key things are
considered, the first is the type of weather parameter and the second is
the evaluation method to be used [4].
In this study user oriented and model oriented evaluation methods are
used. While the user oriented evaluation method which compares model
forecast directly with station data is subjective, the model oriented
evaluation which compares model forecast against a gridded observation
is objective. Validation of model forecast against observed data is
considered essential to ascertain the reliability of the modeled data at
regional scale [5].
However, comparing model forecast and station data alone does not yield
reliable result. Several studies have revealed that incorporation of
satellite observations improves the accuracy of evaluation results [6].
Satellite observations are also important to compensate for areas
having a poor density of synoptic stations. Burkhardt Rockel et al.
confirmed that dynamic downscaling does not necessarily retain or
increase simulation skill of global model fields. Also, Castro et al. [7]
did a work on dynamic downscaling and found out that only
high-resolution landscape features could actually bring new information
into regional model integration. In this paper, the WRF ems model is
used to dynamically downscale the global model with the poorest
performance skill using the type 1 downscaling technique proposed by
Castro et al. [7].
In type 1 dynamic downscaling, the initial and lateral boundary
conditions are used for simulation of the regional model. Three crucial
issues are usually considered when dynamically down scaling a global
field, these are, domain size, lateral boundary conditions and grid
spacing [8].
It is also important that the circulation patterns at different levels
of the atmosphere as predicted by the NWP models are verified against a
reliable data assimilation system. The Global Data Assimilation System
(GDAS) is used in this study. The GDAS shows the actual state of the
atmosphere at the time of occurrence of the weather event and therefore,
gives a diagnostic evaluation of the event.
Materials and Methods
Materials
The data used in this study consist of observed
rainfall data collected from 42 gauge stations across Nigeria for the
21st of March 2015 and precipitation forecast from the European Centre
for Medium Range Weather Forecast (ECMWF), UK Met
office, Global Forecast System of NCEP (GFS) and the Weather Research
and Forecast (WRF version 3.4.1) models for the 21st of March 2015 (Table 1). The available gauge stations are unevenly distributed and sparse as seen in Figure 1,
this usually brings a limitation to the quality of data. To overcome
this limitation, satellite proxies particularly rainfall estimates are
better used as alternatives because of their availability even over
remote areas [6,9]. There were gaps in the gauge observation when compared to widespread heavy rainfall on satellite estimate (Figure 2).
To compensate for the observed gaps CPC rainfall estimate was combined
with the gauge observation. The combined observation data (Figure 3) are used for the model oriented evaluation of this study.


Methods
The performance skill of Numerical Weather Prediction
(NWP) precipitation forecast varies in space and time. Therefore, any
evaluation of NWP precipitation forecast should be aimed at reflecting
this attribute [1].
It is recommended by World Weather Research Program (WWRP 2008) that
evaluation of NWP models is done both against gridded observations which
is model oriented and station observations which are user oriented.
Model oriented evaluation involves processing observation data to match
the temporal and spatial scales of the model while user oriented
evaluation uses station observation to evaluate model forecasts. This
study adopts a similar approach by evaluating the NWP model forecasts
against station and gridded observations. Station-based evaluation was
done by comparing the station rainfall amount and NWP precipitation
amounts using the nearest neighbor approach (The NWP grid cell nearest
to the rainfall Station). This method is simple but suffers limitations
due to unevenly and irregularly spaced measurement stations which may
create some bias [10].
However, this direct comparison facilitates the understanding of
performance skill of NWP models from a user's perspective. Also, the GFS
global model which recorded the least performance skill was dynamically
downscaled using the WRF model. The dynamic downscaling technique used
in this study is the type 1 proposed by Castro et al. [7]
where the initial and lateral boundary conditions of the global model
are used to initialize the regional model. Also, the WRF simulation was
done without a cumulus scheme while the microphysics scheme used is the
Lin et al scheme which is suitable for high resolution simulations less
than 15km.
The user oriented evaluation method used in this study is represented by the contingency table as shown in Table 2
from which some evaluation scores such as Accuracy and bias were
obtained. The verification scores that are obtainable from the
contingency table above are defined below:
1. Accuracy: The level of agreement between forecast and observed
Accuracy= (HITS+CORRECTNEGATIVES)/Total,
2. Bias: Compares the forecast and observed frequency of YES events
Bias= (HITS+FALSEALARM)/(HITS+MISSES)

Critical Success Index (CSI) was also used in this
study. The CSI answers the question on how well the forecast "yes"
events corresponds with the observed "yes" events (WWRP 2008). Since
precipitation forecast is a dichotomous (yes/no) forecast, the CSI is a
good metric for this verification.
The model oriented evaluation methods used in this
study are the Grid statistics which compares a grid point in the
observation field against a grid point in the forecast field and the
Method of Objective-based Diagnostic Evaluation (MODE). The Mode
evaluates the forecast and observation in terms of spatial bias and also
gives the level of relationship between forecast and observed events.
The MODE tool addresses the problem of double penalty commonly
associated with forecast verification. The MODE defines matches and
compares weather events in the observation and forecast fields and then
uses a fuzzy logic to establish a relationship in percentage between
these events. The MODE also gives a Post Script plot containing a
summary of the features and matching between forecast and observed
events.
Results and Discussion
The first step in this evaluation involves the user
oriented evaluation where the forecast fields of the Numerical Weather
Prediction Models are compared directly with the Observation field while
in the second approach, Model oriented evaluation, and Model Evaluation
Tools (MET) are used.
Comparison of NWP forecast with observation
Global models versus observation
Figure 4
shows the map of 24-hour NWP precipitation forecast of three global
models (NCEP-GFS, ECMWF and UKMET) and the observation. The areas in red
are areas of high rainfall
while the areas in green are areas of relatively low rainfall. The
figure reveals that the three global models failed to predict heavy
rainfall over Central and Southern Nigeria. They underestimated the
rainfall event over the region. However, the ECMWF did better than the
other two models in predicting light to moderate rainfall in the region

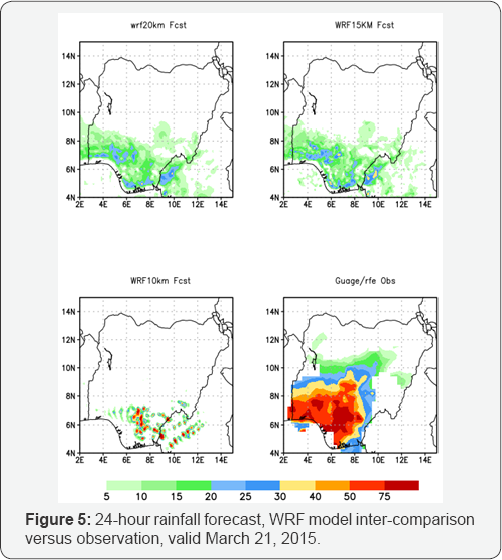
WRF model versus observation
The GFS forecast was dynamically downscaled using the WRF model with resolutions of 20km, 15km and 10km as shown in Figure 5.
The Kain-Fritsh convective parameterization scheme was used for WRF
15km and WRF 20km while convection was turned off for the 10km
simulation as recommended in the WRF model configuration set up.
Dynamical downscaling was done using the same initial and lateral
boundary condition of the GFS model but with increased resolution. The
figure shows that the rainfall forecasts were improved using the WRF
model. Also, the figure reveals that WRF at 10km resolution was able to
predict heavy rainfall in some places within the region. Further
analysis reveals that the WRF model at the top of the boundary layer
showed higher upward motion when compared to the global models. This is a
possible reason why the WRF was able to predict the high intensity
rainfall over the region. Figure 5
however are for eye ball verification and therefore is subjective to an
extent. A more objective and quantitative approach is discussed later
in this work in section.
Categorical verification scores of NWP models
Table 3
shows the verification scores for the Numerical Weather Prediction
models evaluated in this study. The table shows that though the ECMWF
and the WRF 10km have the highest bias of 74%, the recorded the highest
accuracy of 69%.

Point statistics
The point statistics match points on the forecast
field to points on the observation field. It generates some metrics such
as accuracy, Bias, Critical Success Index (SCI) among others. The point
statistics metric that was used in this study is the CSI. This is
considered a good metric for yes or no events such as precipitation. Figure 6
shows the point Statistics map of the NWP models when compared with the
gauge observation. The map shows the Critical Success Index (CSI)
values of the models for different rainfall amount thresholds. Rainfall
thresholds of 5, 10, 15, 20, 25 and 30mm were used. The figure reveals
that the GFS and the UKMET showed poor skills in predicting rainfall
amount in excess of 5mm for the case under study while the ECMWF (red)
was better for rainfall thresholds between 5-15mm. Also, the WRF model
was better in predicting rainfall above 20mm having recorded a critical
Success index of 40% when compared with the other models.

Model oriented evaluation of NWP models
Grid statistics


The grid statistics match events on the forecast grid against events on the observation grid box. Figure 7
shows the grid statistics map of Critical Success Index of the
Numerical weather prediction Models when compared with the combined
observation. From the Figure 7 & 8,
The ECMWF has a higher CSI for rainfall threshold between 5 and 18mm
while the WRF model was better for heavier rainfall values greater than
18mm.
Method of objective based diagnostic evaluation (MODE)
The MODE matches events on the forecast field against
events on the observation field and establishes a relationship in
percentage between forecast and observation using a fuzzy logic. This
Tool is objective and unique for the fact that it's never in a hurry to
discard a forecast model if it fails to predict an event over a
particular place. It looks out for possibility of spatial misplacement
of events and tries to generate a correction for that. Different
rainfall thresholds are considered in this analysis. For the GFS and
UKMET models rainfall of over 10mm was chosen. Figure 6 shows the MODE analysis plot for the NCEP-GFS forecast of 21st March 2015.

The red polygons (middle left and middle right) are
areas of 10mm and above rainfall in the forecast and observation events.
Despite the difference in the sizes of the polygons, MODE analysis
found 87% relationship between the forecast and the observed. In Figure 9,
the Mode analysis for the UKMET model forecast for rainfall of 10mm and
above reveals that there is 88% relationship between forecast and
observed event. Figure 10
shows the MODE analysis for the ECMWF model precipitation forecast for
rainfall amount of 25mm and above. Despite the differences in size and
orientation of the polygons, 88% relationship between forecast and
observed was established. The 30mm and above rainfall events in WRF 10km
forecast and observation are shown in red shaded polygons (middle left
and middle right) of Figure 11.
The figure shows that the size and orientation of the red
polygons in the observation and forecast field are almost the same. The
MODE analysis also found 93% relationship between forecast and observed
events. This relationship of over 90% implies that the WRF 10km did
well in forecasting rainfall of over 30mm in the region. This is in
agreement with the earlier metric (CSI) used in this study. The higher
updraft produced by the WRF 10km when compared with the global models at
the top of the boundary layer is responsible for the high intensity
rainfall as forecast.


Conclusion
This study evaluated the performance of precipitation
forecast from four Numerical Weather Prediction (NWP) models, NCEP-GFS,
UKMET, ECMWF global models and the WRF regional model for a case of
heavy and widespread rainfall over Central and Southern Nigeria on 21st
March, 2015. The model forecasts were compared directly with gauge
observation and also with combined gauge and satellite observation. A
number of model evaluation tools were used for the evaluation.
The results showed that the ECMWF and the WRF models
recorded the highest accuracy of 69% in terms of categorical forecast
when the model precipitation forecasts were compared directly with gauge
observations. However, the global models were not able to forecast the
event in terms of intensity, even though the ECMWF model was relatively
better than the GFS and the UKMET having forecast light to moderate
rainfall over the area. The NCEP-GFS model which showed a poor
prediction skill for the event under study was dynamically downscaled
using the WRF regional model. The initial and lateral boundary
conditions of the NCEP-GFS were retained while the resolution was
increased to 10km. Lin et al. microphysics scheme was used while
convection was turned off. The WRF regional model at 10km resolution
showed a remarkable improvement of the GFS in predicting the event in
terms of intensity. Also the point and grid statistics showed that the
WRF regional model was better in predicting rainfall amount greater than
30mm over the region under study.
The MODE analysis indicates that the WRF model gave a
better relationship between forecast event and observed event with the
highest relationship of 93%. Further analysis also revealed that the WRF
model at 10km showed a higher vertical motion at the top of the
boundary layer when compared with the global models. This is a reason
why the WRF was able to predict high intensity rainfall over the region.
The implication is that, down scaling a global model using a regional
model such as the WRF is likely going to give a better performance skill
of precipitation forecast. It is worthy to note that these results were
for a case study of heavy rainfall over Central and Southern Nigeria as
a single event is not enough to make a categorical statement regarding
the overall performance and skill of these models. Therefore, a study of
several cases of widespread rainfall over Nigeria is recommended for
better evaluation of these models.
Acknowledgement
The Authors are thankful to the Nigerian
Meteorological Agency (NIMET) for providing the observation data used in
this work. We also thank Igado Nicholas GIS experts for their
contributions in the area of GIS/RS analysis (correction and
digitization).
For more
details Open Access Journal of Toxicology (OAJT) please
click on: https://juniperpublishers.com/oajt/index.php
To read more…Full Text
in in Juniper Publishers click on https://juniperpublishers.com/oajt/OAJT.MS.ID.555569.php


Comments
Post a Comment